The Index of Multiple Deprivation (IMD) 2025 gives us the most complete picture of deprivation in London.
The previous edition came out in 2019, meaning we can compare two snapshots to see how deprivation in London is changing.
We need to be careful when doing this - the government cautions that methodology changes mean the two can't be treated as a strict time series.
But comparing how broader patterns of deprivation have shifted, as the government's own analysis does, helps us to identify key trends.
In the last instalment of our IMD deep dive, we looked at most deprived neighbourhoods in London, and found that the core geography of the most extreme deprivation in London hasn’t changed.
Here, we look at the broader picture – to see where in London has seen the biggest changes in deprivation level.
Significant change in IMD Decile 2019-2025 (2019-2025)
A growing North / South divide?
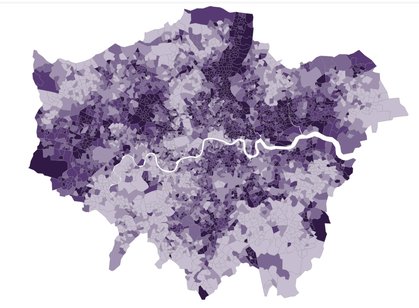
This map shows the neighbourhoods which have significantly change their deprivation level between 2019 and 2025:
- In red are those that are now ranked as significantly more deprived – either moving 2+ deciles or into the most deprived decile
- In green those that are now ranked as significantly less deprived - either moving 2+ deciles or into the least deprived decile
In general, we can see a North / South divide. Of the 617 neighbourhoods that are significantly more deprived than in 2019, 90% are in boroughs North of the river.
Most of these neighbourhoods are in Outer London boroughs, especially in North and West London – Barnet, Brent and Ealing have the highest number.
Only 63 are in South London boroughs – and 25 of these neighbourhoods are in just two boroughs, Greenwich and Croydon.
A more complicated picture for 'improving' neighbourhoods
The North / South divide is very clear when we look at neighbourhoods that have become more deprived. But it isn't as obvious when we look at neighbourhoods that have improved in their ranking.
556 neighbourhoods in London saw their deprivation ranking improve significantly between the two IMD's of 2019 and 2025. They’re almost equally split between North and South London.
The boroughs that have the highest number of neighbourhoods ranking as less deprived are all in Inner London: Lambeth, Southwark and Hackney.
Again, we need to be careful about drawing too many conclusions from these comparisons, as they could reflect changes in methodology rather than a genuine shift.
But the geographic pattern is striking, and it's one worth watching closely.
Read the next part of our deprivation deep dive series, exploring why the IMD often underestimates deprivation in London.
Also in this series: