In the first part of our deprivation deep dive, we explored where the largest clusters of deprivation in London are. But this doesn't present the full story.
Beyond those clusters, pockets of the most extreme deprivation exist all over the city, including in boroughs that are often thought of as less deprived.
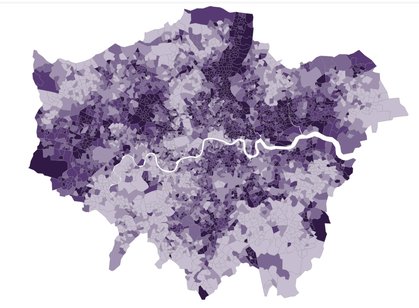
The Index of Multiple Deprivation (IMD) 2025 allows us to see this hyper-local picture, and reveals inequality that borough-wide figures can hide.
Click through the tabs below to explore deprivation across four London boroughs: Bromley, Havering, Islington and Richmond.
We chose these boroughs to explore in more depth because, according to our borough level poverty indicator, they have significantly lower levels of poverty than the London average, and they represent a varied geographic spread across the city.
The IMD 2025 in boroughs with low poverty rates
IMD Bromley (2025)
Bromley has London's lowest poverty rate. But that headline figure hides pockets of real deprivation.
As you'd expect, most of its neighbourhoods sit in the least deprived category. Yet across the borough, 14 neighbourhoods fall within the most deprived 20% in London.
All of these neighbourhoods are in the northern half of the borough, and they're especially clustered in the North East.
IMD Havering (2025)
Havering in East London echoes the pattern we saw in Bromley: pockets of deprivation on the very edge of the city.
Despite a low poverty rate, it's home to 10 neighbourhoods in the most deprived category, and the borough shows a clear divide.
Its most deprived neighbourhoods cluster in the north and west of the borough, while the eastern half is largely in the least deprived category.
IMD Islington (2025)
Islington presents a different picture. It has the lowest poverty rate of any Inner London borough, but the IMD reveals a patchwork: neighbourhoods at every level of deprivation sitting side by side.
IMD Richmond upon Thames (2025)
Richmond upon Thames is often seen as London’s wealthiest boroughs. On most of our indicators it performs extremely highly – with low levels of poverty, unemployment, and high education and health outcomes.
The IMD reflects this picture. Around three quarters of its neighbourhoods are in the least deprived category.
But even in leafy, wealthy Richmond, there are two neighbourhoods in the most deprived 20% neighbourhoods in London, both in the far west of the borough.
The IMD helps to reveal what borough level data often misses out. Deprivation is hyper-local, and inequality exists everywhere in London - even in its wealthiest areas.
These four boroughs are just a snapshot. Explore our full IMD 2025 maps to explore deprivation across the city.
Read the next part of our deprivation deep dive, 'The core geography of deprivation in London hasn’t changed'.
Also in this series: