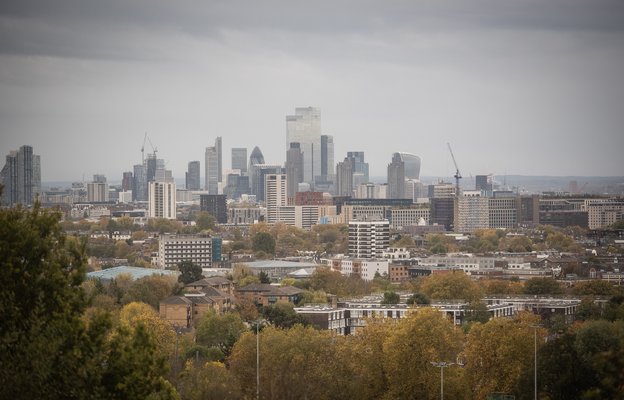
Understanding London
Many Londoners struggle to make ends meet, secure good quality affordable housing, or tie down the decent work they need to lift themselves above the poverty line.
But who makes up London's diverse populations? Who is in poverty, and where do they live? And how do London's unique characteristics and challenges contribute to it’s sky-high poverty levels?
London’s Poverty Profile gives you evidence and insight on these questions and more. Explore over 100 different indicators covering topics like housing, work, education, welfare benefits, and London’s diverse demography.
Explore London's Poverty Profile
-
By Topic
Explore data on different topics like housing, work, living standards and issues like food, violence and air-pollution.
-
By Population
Poverty impacts everyone differently - explore what it looks like for different people across age groups, ethnicity, migrant status, disability, work status and more.
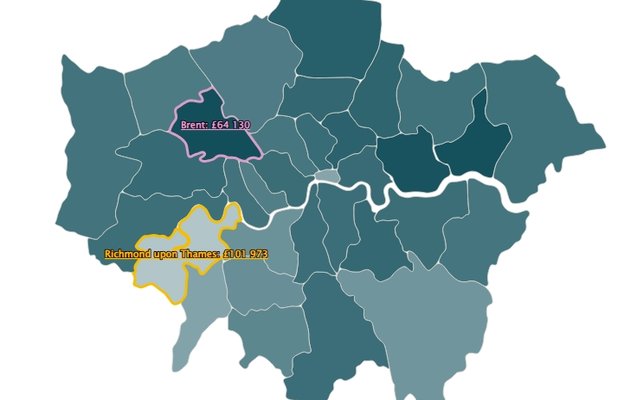
-
By Borough
Learn about the unique make up of poverty and inequality in each of London's 32 boroughs.
London in numbers
-
25%
of Londoners are living in poverty after housing costs -
33%
of Londoners living in non-white households are living in poverty after housing costs -
47%
of single parents in London are living in poverty after housing costs
Most visited indicators
Not sure where to start? Explore some of our most popular indicators.
-
London's geography and population
Around 8.8 million people live in London, of which 46% are Black and Minority Ethnic and 41% are not born in the UK. Explore London's unique geography and it's populations using this indicator.
-
Poverty definitions and thresholds
Households are considered to be below the UK poverty line if their income is under 60% of the median household income after housing costs for that year. Find out more using this indicator.
-
Crime and income deprivation
Recorded crime in London is more prevalent in the neighbourhoods with the highest levels of income deprivation. Use this indicator to find out more.
You might also be interested in
-
London's Cost of Living Tracker
This cost of living tracker helps us see how much more a household would have to spend to maintain the same standard of living they had in 2020. And which household types are most likely to have had to scale back on essentials.
-
Census 2021
The Census 2021 provides us with the most comprehensive and up to date picture of London’s population. Explore a series of interactive maps to see what the data shows us about deprivation within different London populations, right down to a neighbourhood level.