What does poverty look like in one of the world’s wealthiest cities?
Here we explore 10 charts to help reveal the picture of poverty in London at the start of 2026, showing us where our capital’s problems lie and what needs to change to tackle poverty.
As 2026 unfolds, we’ll continue to update London’s Poverty Profile with the latest data to give us the clearest picture of what’s happening in London.
1. A third of children are growing up in poverty
Proportion of children in poverty before and after housing costs by London borough (2023/24)
A third of children in London are growing up in poverty. In some boroughs, the picture is far starker. Nearly half of children in Tower Hamlets – 47% – are growing up in poverty. Growing up without enough affects everything from health and education to future prospects.
There's one piece of good news as we enter 2026. Late last year, the government scrapped the two-child limit – a decision that will lift thousands of London's children out of poverty. But for rates this high to really shift, we need further and bolder action, particularly on housing.
2. High housing costs
Housing costs as proportion of net income for households in poverty (2023/24)
Every region has its own poverty story. London's is characterised by the extortionate cost of housing.
Across all rental sectors, a one-bed flat in London costs significantly more than anywhere else in England. The consequences are stark: London households in poverty spend 57% of their income on housing, compared to 33% elsewhere in England.
When rent takes more than half of what you earn, everything else – food, heating, children's clothes – becomes a struggle.
3. The homelessness crisis
People sleeping rough in London (2008/09 - 2024/25)
In 2024/25, nearly 12,000 people were seen sleeping rough in London – four times the number 15 years ago.
This isn't improving. Most boroughs saw rough sleeping increase last year. In Hillingdon, it rose by 66%.
Get the latest data, analysis & research on poverty in London delivered straight to your inbox. Sign up to London's Poverty Profile - monthly briefing.
4. Temporary accommodation
Total number of households in Temporary Accommodation (2011-2024)
The number of rough sleepers in London is a stark and visible representation of our city’s problem with homelessness. But behind closed doors there's a less visible but even more widespread crisis.
In 2024, the last full year we have data for, just under 70,000 households in London were homeless and in temporary accommodation (TA). That equates to around 1 in 50 Londoners – and on average one child in every classroom.
Temporary accommodation was designed to be exactly that: temporary. Instead, families are stuck for months or years, often in poor-quality housing. We're campaigning to improve conditions for the thousands of Londoners trapped in this system while we work towards the real solution: enough genuinely affordable homes.
5. Ten-year high social housing waiting lists
AOne of the key issues is the lack of genuinely affordable, and especially social housing in London. In 2024 – the most recent year we currently have data for – there were 336,000 households in London on the social housing waiting list.
This is more than 100,000 higher than any other region of England. It’s also a 10-year high.
When families can’t access social housing, they’re often pushed into the expensive private rental market – which in London is extortionate.
6. A tale of two cities
Healthy life expectancy at birth by borough for men and women (2021-2023)
Poverty can shape so much of your life: how long you live, and how many of those years you spend in good health.
A woman born in Richmond can expect 13 more years of healthy life than a woman born in Lewisham.
These gaps mirror the child poverty divide we illustrated earlier. Where you're born in London still determines far too much about how your life will unfold.
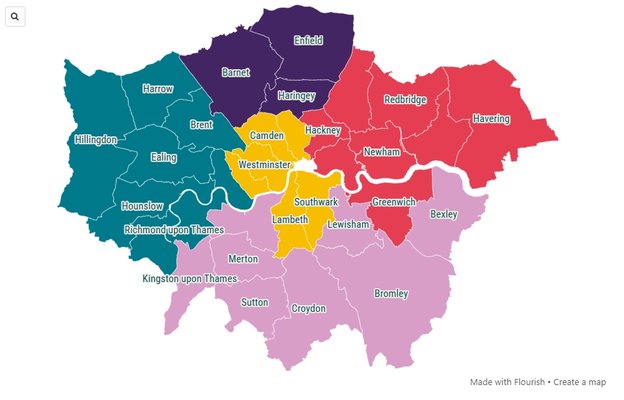
7. A patchwork of deprivation
English Index of Multiple Deprivation, rebased for London (2025)
A short walk around any part of London will show you the huge level of inequality in the city. Wealth and poverty sit side by side, in every borough.
Towards the end of 2025, the latest English Index of Multiple Deprivation was published – giving us the most accurate picture of deprivation at a local level.
It shows hotspots of extreme deprivation stretching through Tower Hamlets, Hackney and Islington, across swathes of East London, and up through the Lea Valley into Enfield. Meanwhile, much of outer south-west London – Richmond, Kingston – remains among England's least deprived areas.
8. Youth unemployment is going up
Unemployment rates by age group (2004 Q4 - 2025 Q2)
One concerning trend to keep an eye on throughout 2026 is the unemployment rate. Between 2022 and 2025, London’s unemployment rate has been increasing – especially among young people.
17% of young Londoners (16-25) are now unemployed – compared to 4% of older Londoners. That's also higher than youth unemployment elsewhere in the country.
Part of the explanation is a shrinking job market – fewer vacancies, particularly in sectors young Londoners have traditionally relied on. As AI continues to reshape the economy, this could be a trend with significant implications for poverty in the years ahead.
Read more analysis about the rising unemployment rate among young Londoners.
9. And so is worklessness
Proportion of Londoners aged 16-64 receiving out-of-work benefits by benefit type (2013-2025 Q2)
Unemployment figures only capture people actively seeking work. The full picture is broader.
In May 2025, the proportion of Londoners on out-of-work benefits passed 15% – higher even than during the Covid-19 pandemic.
People are out of work for many reasons: illness, caring responsibilities, lack of suitable jobs. But with benefit levels so low, those relying on social security often can't afford essentials, let alone build a stable life.
10. Work isn't the escape route it should be
Employment status of all adults aged 16+ in poverty (2011/12 - 2023/24)
Perhaps the most striking chart of all: half of Londoners in poverty are already in work.
This often surprises people. Employment is meant to be the best route of poverty – but for many, it’s not enough.
This isn't the case in the rest of England, where the majority of people in poverty are either unemployed or economically inactive.
Two factors drive this. Firstly, wages often fail to match London's costs – too many Londoners are stuck in low-paid work.
Secondly, insecure contracts are rife, leaving people without the stability they need to plan ahead or build savings. That’s why the next phase of the London Living Wage campaign will focus on Living Hours as well as wage rates.
These 10 charts paint a picture of inequality and poverty in London – a city home to extraordinary wealth, but where so many of its residents are struggling just to get by.
Understanding where the problems lie is the first step to fixing them.
Explore all the data at London's Poverty Profile – our regularly updated resource tracking poverty and inequality across the capital.